
Why We Are Pausing the Passenger Train Program and Focusing on Freight Trains
Aerodynamics, especially on bluff bodies like trains, is a subject where humans intuitions, theories and advanced computer simulations will often fly off the rails when they encounter the chaos and turbulence of the real world. Empirical studies are of the highest importance and small differences in setups can lead to big differences in results. The famous statistician Andrew Gelman has the quote “You have to want to falsify the model. If you love somebody, set them free.” So here we are, setting free the idea that current RoofRider designs can reduce drag on passenger trains. It does still seem to work on freight trains which lack gangways between cars and have greater surface friction, only that part of the program will continue.
Figure 1: Summary of Previous Testing Results

We conducted 1/20 scale and 50 meters per second testing on an ICE2 commuter train model nicknamed “Ice Ice Baby” between the 22nd of November and 1st of December 2021 at TU Berlin University in their GroWiKa wind tunnel. You can see some photos of this train model and the wind tunnel below.
Figure 2: Installing ICE ICE Baby

The setup included · The ability to turn the model inside of the tunnel to test the impact of crosswinds. · 64 surface pressure sensors inside of the train. · A modular inter-car gap to test different RoofRider designs, inter-car gap sizes and even close off the gap completely. · A boundary layer rake on certain runs to measure the size of the boundary layer on the roof of the train. · Turbulence tape and a larger turbulator straight out of Mad Max designed to measure performance with a larger boundary layer, as might occur at full scale/higher Reynold’s numbers. · Flow viz paint to image the flow of air around the train.
Figure 3: Setting up 64 pressure taps
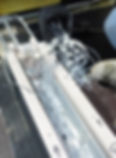
Figure 4: Inter-car gap with RoofRider installed (small ridges next to gap)

Figure 5: Boundary layer rake

Figure 6: LeMons contestant turbulator

Figure 7: Flow viz paint
The major result of interest can be seen in the chart below, the Case9 RoofRider equipped train had a Cd equal to or higher than that of the baseline at 0,5 and 10 degrees yaw. They increased the drag at 0 degrees yaw by 1.7% though the difference wasn’t statistically significant in a basic t-test (p-value 0.11.) Placing the RoofRiders only on the first of the two gaps in the train or only ahead of the gaps did not improve results either.
Figure 8: Coefficient of drag given deflector type and yaw

One positive sign was that the RoofRider did successfully reduce impingement into the inter-car gap and pressure drag on the front face of following cars, as shown in figure 9. This means that it is reducing the pressure drag at the top of the inter-car gap region, but unfortunately offsetting negative impacts happened elsewhere. One of those offsetting impacts was higher pressure drag at the 0.98 and 2.02 x(m) positions which were right in front of the deflector.
Figure 9: Surface pressures inside of the two inter-car gaps (x is distance from the front of the train)

The boundary layer on the top of the train was slightly higher with the RoofRider installed with lower velocities inside of the boundary layer. This could be a good or bad thing for drag depending on the surface roughness of the train, whether the train is inside of a tunnel etc.
Figure 10: Boundary layer chart on the top of the train

The RoofRider was also tested at longest possible gap length along with six other alternative designs. Runs were also done at this gap length with the big turbulator installed. All results were again negative.
Figure 12: RoofRider and alternate design performance with and without the big turbulator at the largest gap size

Figure 13: Alternative RoofRider designs Opt1 through Opt6 in order


The impacts of different gap sizes without deflectors installed were startling and may end being the most important part of this study. The drag reduction produced by fully closing off the gap was much smaller than expected at 2.7%. The largest gap size (longest gap length combined with shortest gangway) in contrast increased the drag by around 10.7%. Yaw angles of 5 and 10 degrees produced increases in drag of 9 and 11% respectively, which is a good reminder that crosswinds can increase aerodynamic drag on trains dramatically even for short three car trains like this one.
Figure 14: Impact of gap size and yaw degree

We want to thank the TU Berlin University/Hermann-Foettinger-Institute team, especially Marvin Jentzsch, Dr. Christian Nayeri and Daniel Patzke an undergraduate student who spent over a week of 10+ hour days working in the wind tunnel without pay and skipping all of his classes so he could have something to write his thesis on. When that thesis comes out it will give a much more detailed and rigorous guide to these results. Jonathan Tshcepe was also very helpful with advice. I should also say that, negative results or not, the whole experience was a lot of fun for us and working in a wind tunnel is always exciting. If anyone reading this is considering a career in aerodynamics, please know that!
The failed replication of the earlier DES and RANS results showing savings from the RoofRider on an ICE2 train shouldn’t be blamed on the University of Birmingham team, the members of which are exemplary and did rigorous work. The current results just show that physical testing is still integral even in today’s world, and CFD will sometimes mislead when studying new problems. We had done a moving scale model test as well with the University of Birmingham but the light sensors which would have given us a Cd value from that failed. We were left only with the DES results and the pressure sensor results from the moving model test, which seemed to match and showed a drop in pressure within the inter-car gap. There is still some small chance that the original CFD results were the correct ones, and that the lack of a moving ground (or the extra smooth underbody of the model used to compensate for that) made these wind tunnel results incorrect. However that seems unlikely, especially because our own internal CFD estimates with a moving ground also failed to show any savings on an ICE2 train. The discrepancy may have been due to much larger surface friction estimates from the University of Birmingham testing. As most aerodynamics researchers can attest even the best built CFD models will sometimes fail, and the time when wind tunnel testing can be fully replaced with CFD still seems far off.
We are still very optimistic about the RoofRider on freight trains, expect to see some CFD results from testing that we are currently doing soon!